

Writing Work
SEO-driven pieces tied to measured results
Pumpkin Insurance — SERP Ranking Increase

-
Pumpkin is a leading pet insurance provider that helps pet parents access affordable, high-quality veterinary care.
The company’s content hub serves as an educational resource for pet owners researching coverage options, conditions, and costs.
-
Improve search rankings of core topic and pillar pages to increase organic traffic and visibility for high-intent keywords (e.g., “pet insurance surgery coverage,” “when to get pet insurance”).
-
Rewrote and restructured articles to better align with Pumpkin’s brand voice, tone, and compliance guidelines
Added user-centric sections emphasizing the cost-effectiveness and value of coverage
Introduced FAQs to capture long-tail search queries and improve snippet eligibility
Enhanced internal linking for better crawlability and user flow
Added clear, contextual CTAs to guide readers toward plan exploration and quotes
-
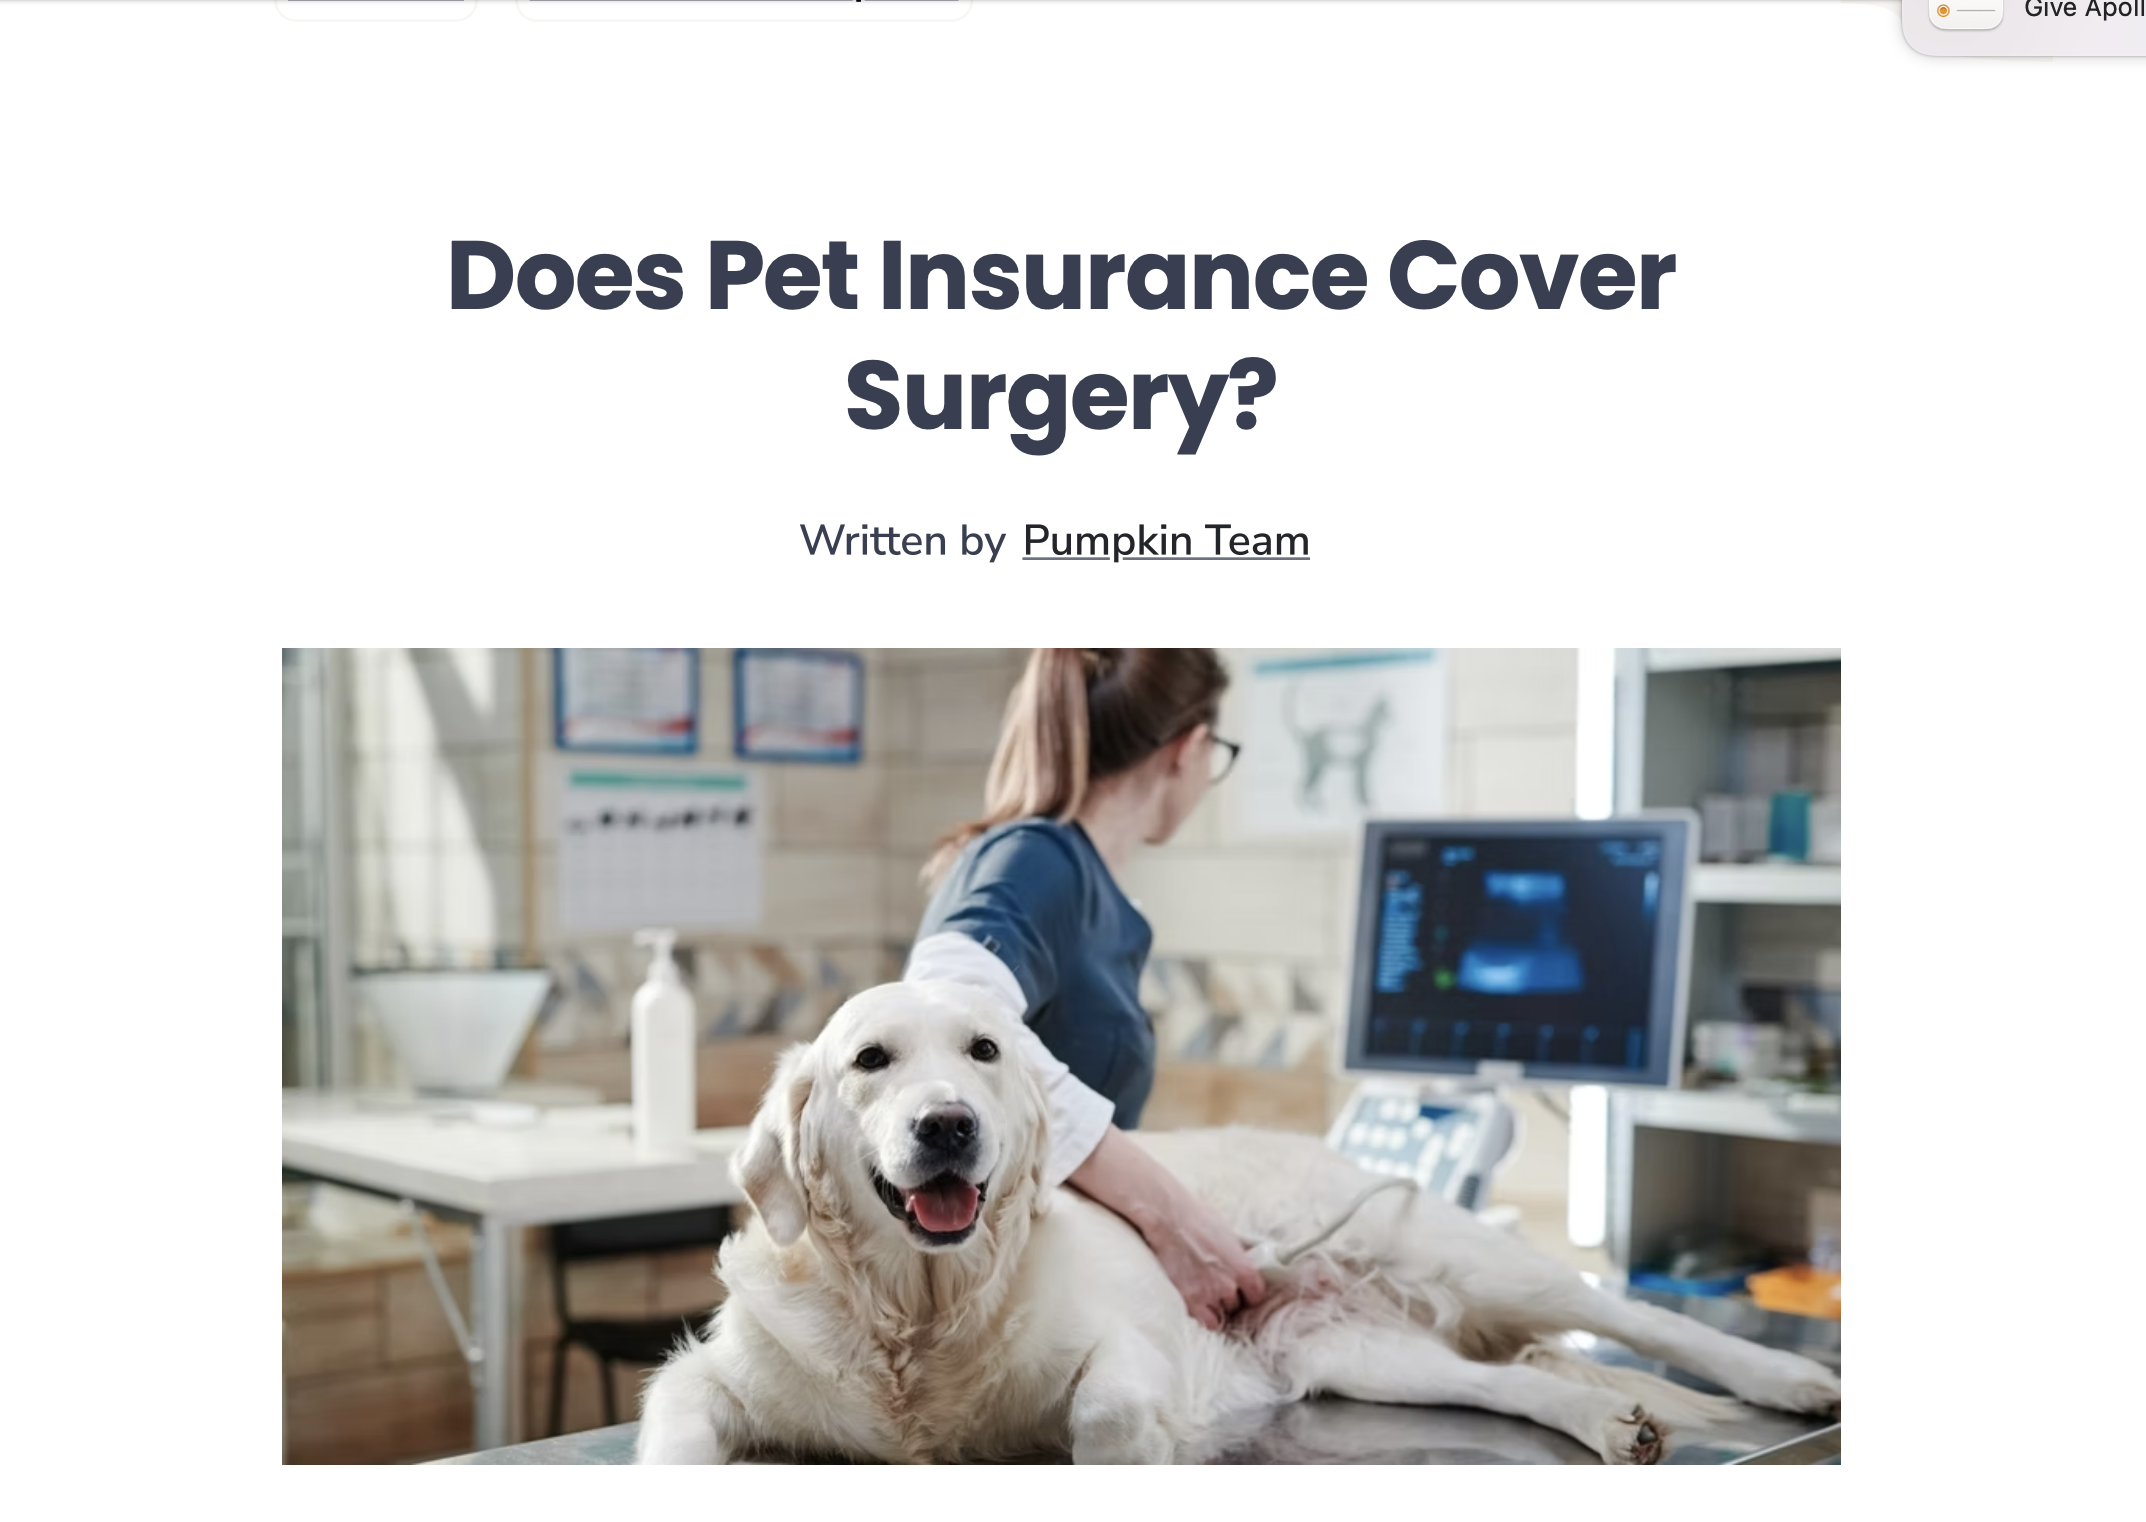
Does Pet Insurance Cover Surgery
Old rank: Page 3
New rank: Page 1
When to get Pet InsuranceOld rank: Page 5
New rank: Page 3Results Summary:
Improved visibility for two high-value search terms within 60 days of optimization
Strengthened user engagement and alignment with SEO best practices
Contributed to broader organic traffic growth across Pumpkin’s educational content hub
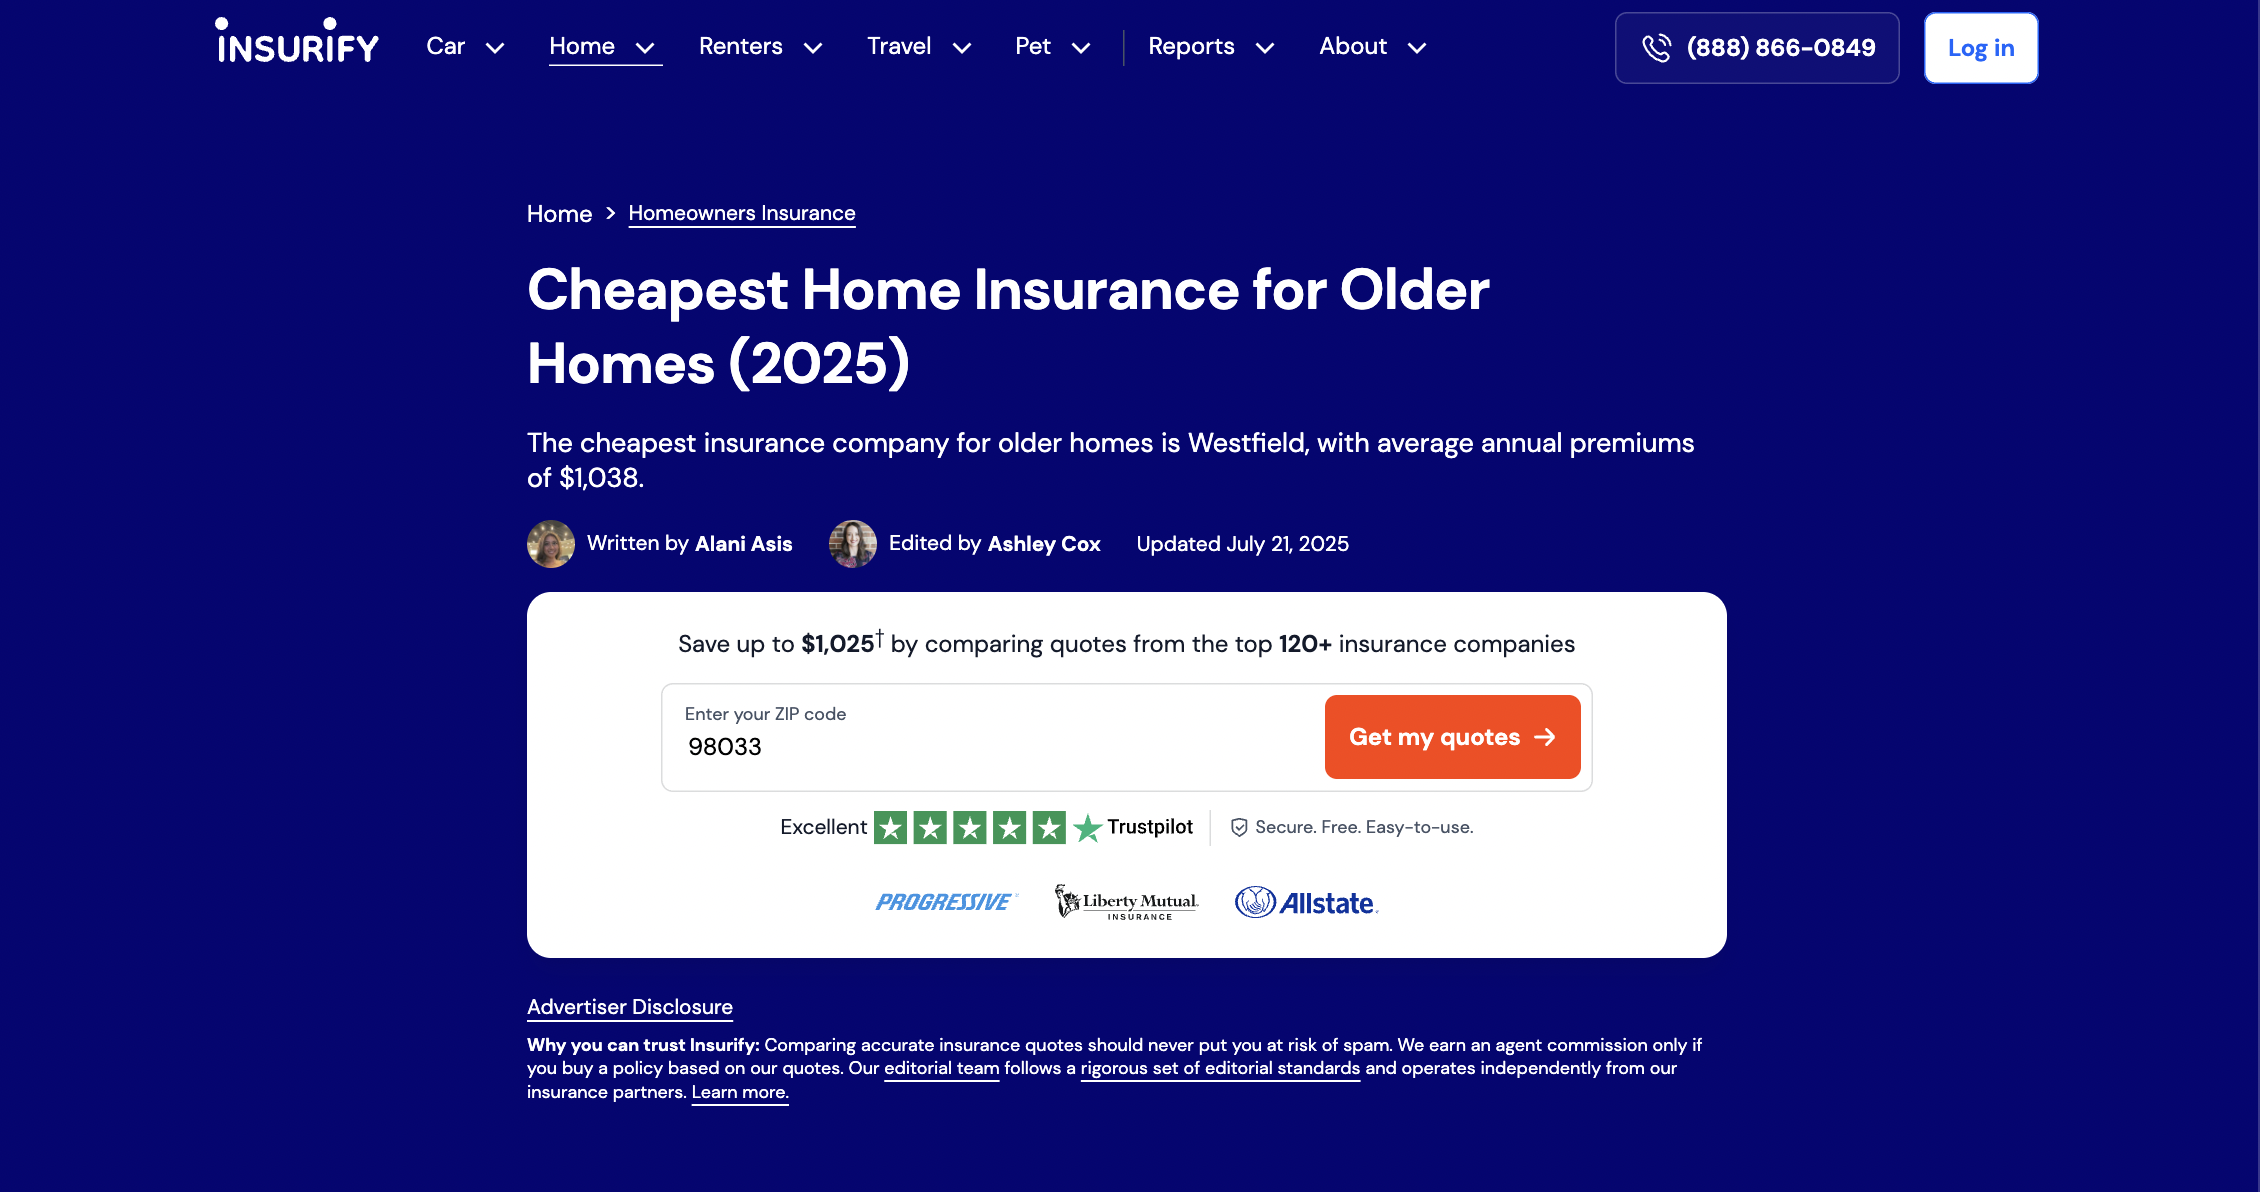
The Cheapest Home Insurance for Older Adults

Client
Insurify
Published:
July 21, 2025
An SEO explainer piece that ranked #1 on Google and was cited on Google AI Generative Search.
Strategy Case Studies
Driving business growth
Best Full-Coverage Car Insurance


An SEO round-up that ranked #1 on Google and was cited on Google AI Generative Search.
Client
Insider
Published:
April 30, 2025
New Tech Seattle:
Email & LinkedIn Strategy
-
New Tech Seattle is a leading tech community organization that connects professionals and founders across the Pacific Northwest through events, partnerships, and newsletters.
-
New Tech wanted to re-engage its large membership base through stronger newsletter performance and social content that reflected its mission. The challenge was stabilizing engagement while expanding reach organically.
-
The audience includes Washington-based tech professionals, founders, and startups.
Tone: professional yet community-driven — approachable, optimistic, and informed, emphasizing connection and innovation within the local tech ecosystem.
-
Beginning in September 2025, I conducted a content audit and implemented a data-informed content strategy across email and social channels.
Key steps included:Restructuring newsletter sections for clarity and consistent CTAs
Optimizing send cadence and subject lines for higher open and click rates
Building an editorial rhythm across LinkedIn to promote events, partners, and tech news with measurable ROI
Introducing visual consistency and audience segmentation
-
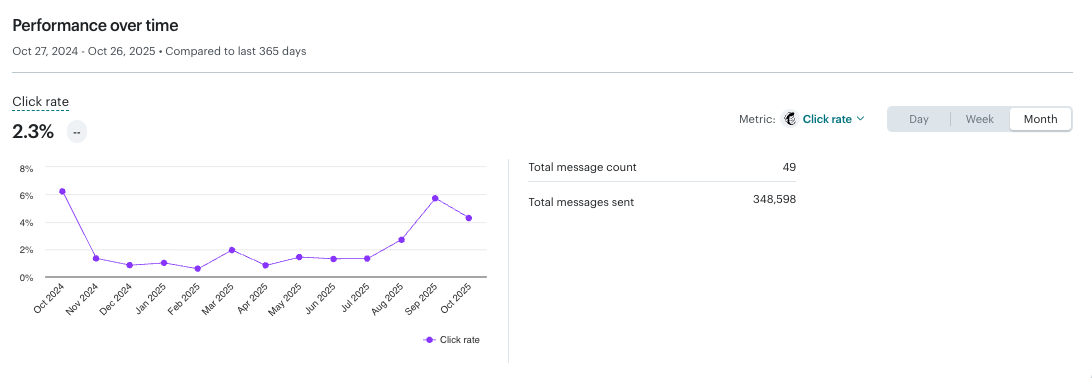
Open rate grew from 20% to nearly 30% after September, sustaining performance across 349K+ messages sent
Click rate more than doubled from under 1% to 2–3%, showing improved audience engagement and CTA relevance
-
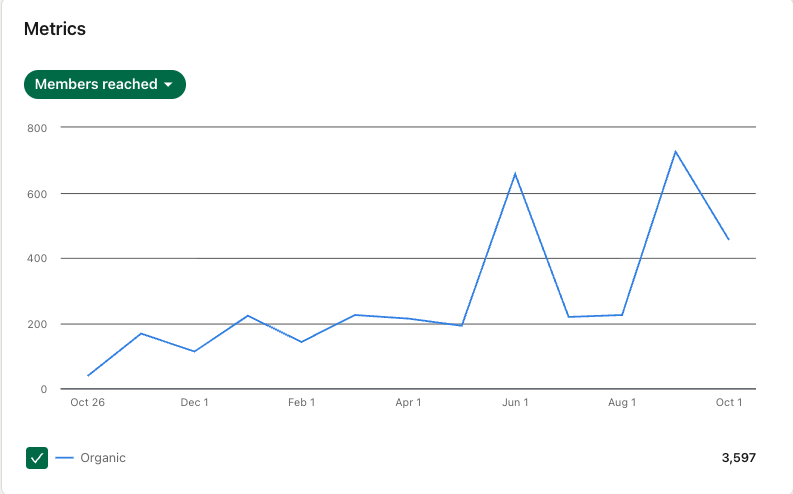
Reach jumped dramatically to around 700+ members, one of the highest spikes of the year.
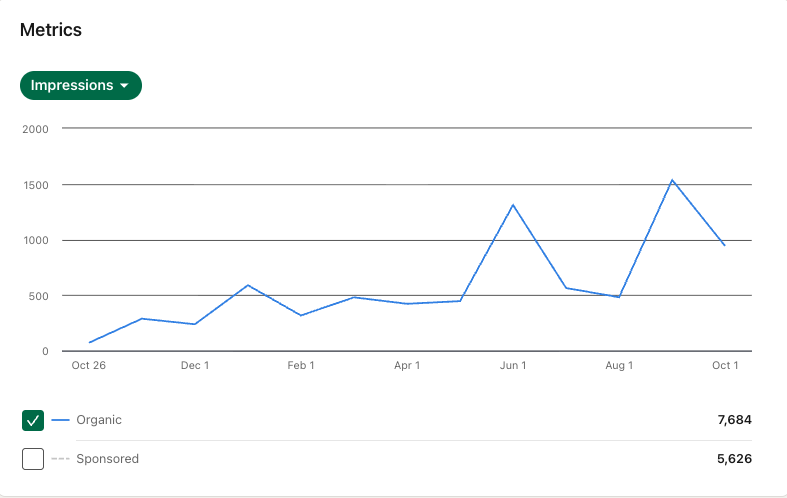
Impressions peaked at around 1,500 — again, one of the highest data points shown. A 2.5–3x lift in visibility compared to earlier months.
New Tech Seattle: Strategy Analytics
For context, I started early September.
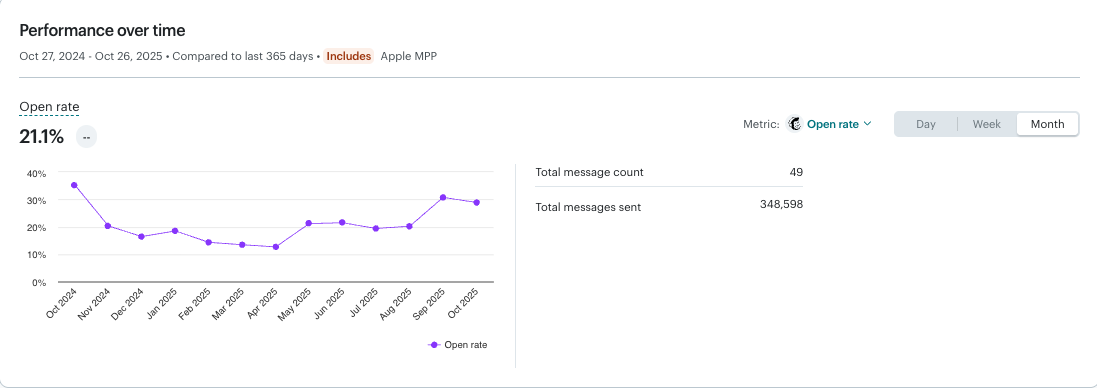
~10% increase in open rates
~3x increased reach than over the prior average.
~2.5% increase in click rates
~ 2.5x lift in visibility compared to earlier months
More on my
Portfolio
And 400+ More….
Want to see a specific piece? Don’t hesitate to ask!